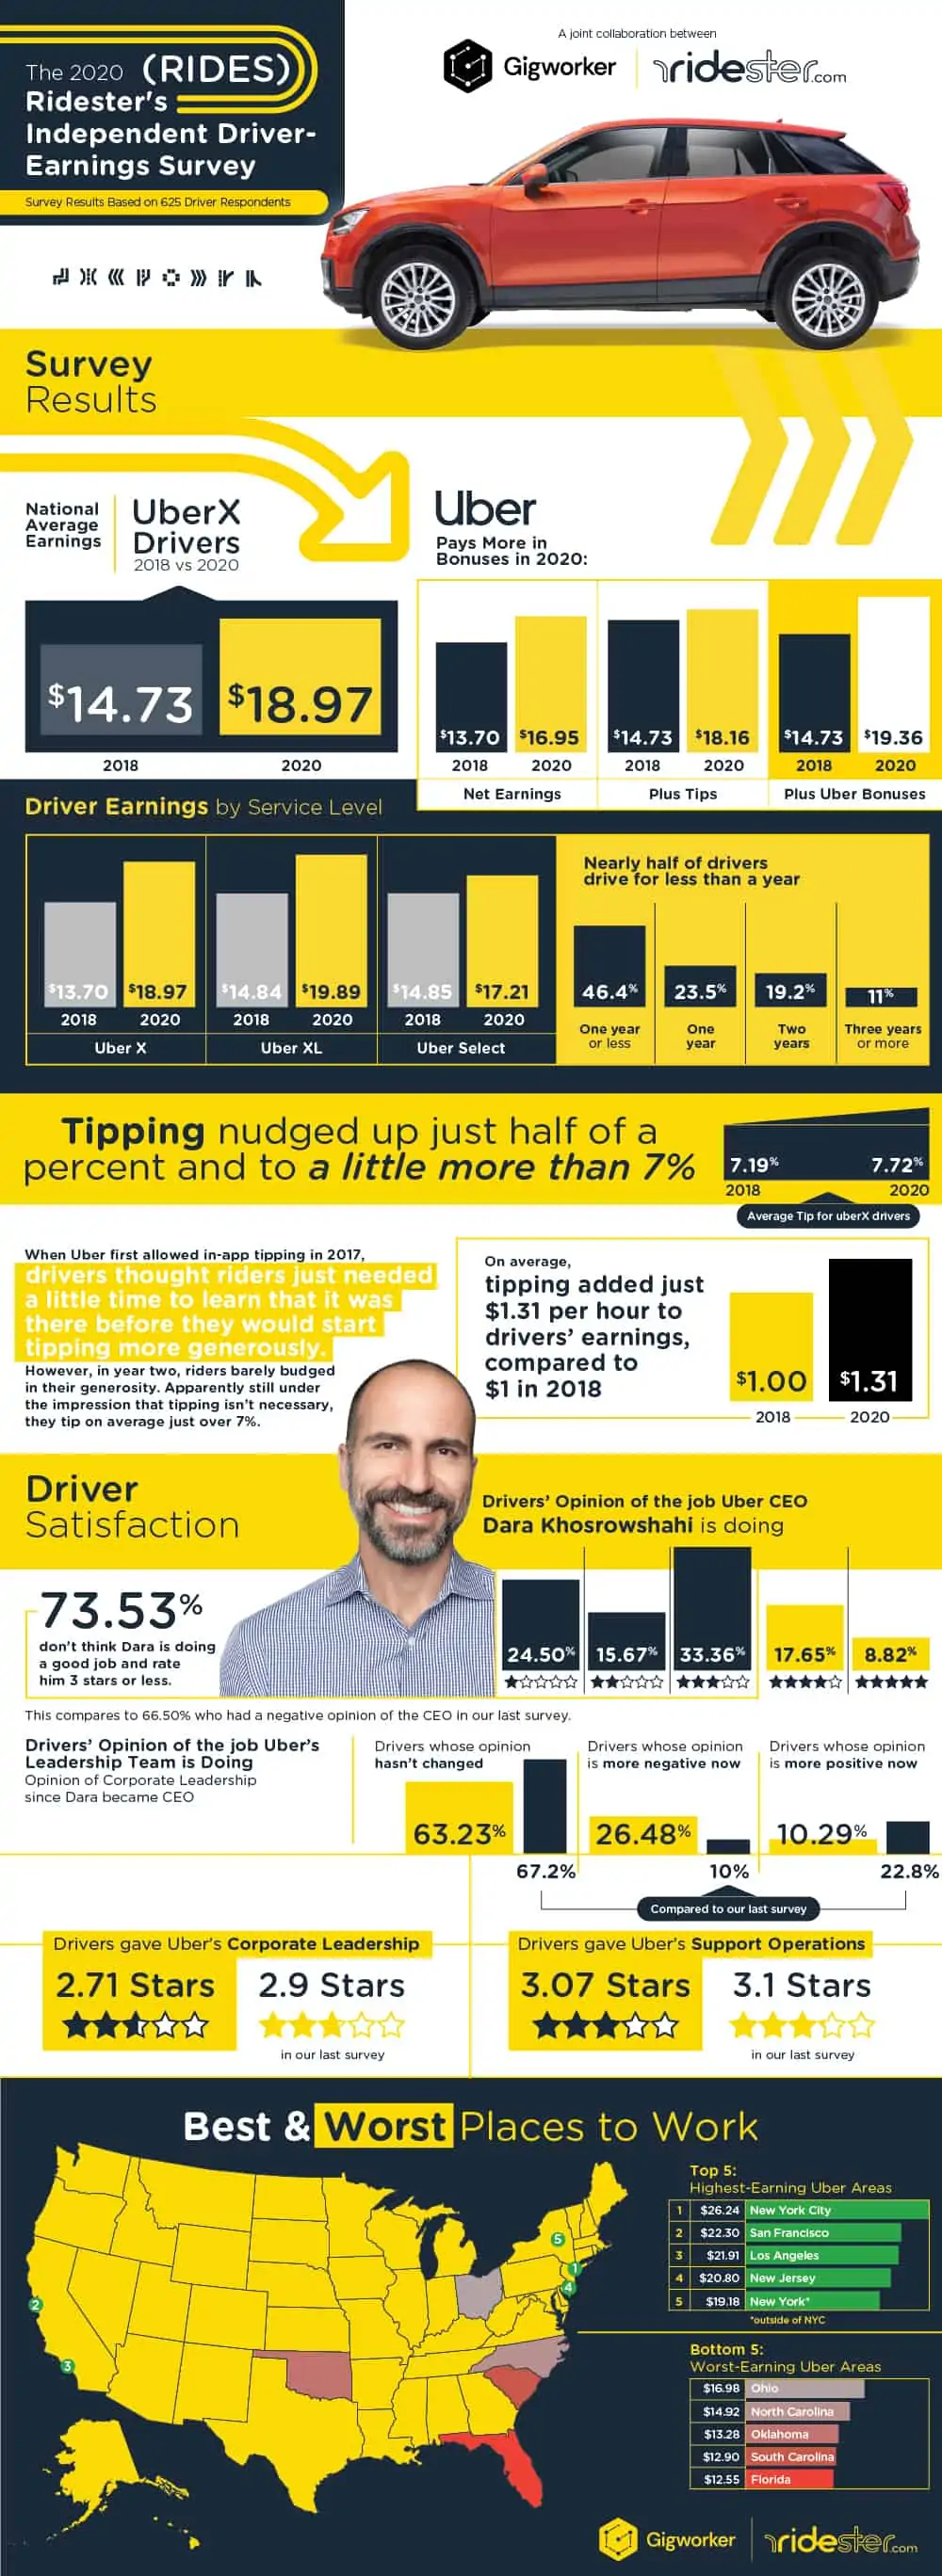
Uber drivers are making significantly more today than they were a year and a half ago, according to the 2020 RIDES Driver Earnings Survey.
In surprising findings:
- Uber X drivers are earning, on average, 38.46% more than they did in our last survey conducted a year and a half ago.
- New York City drivers skyrocketed from sixth place to first place to become the top earners in the nation as an apparent result of the city’s new ride-hail regulations.
- Uber is paying more in driver incentives and bonuses to keep drivers on the road and to exercise more control over their work.
We’ll break down our findings in detail below.
- Introduction to the RIDES Survey
- Survey Highlights
- Survey Summary
- Earnings Results
- Tips Nudged up Half a Percent but Still in the 7% Range
- Driver Sentiment
- The Best and Worst Earning Cities
- NYC Drivers are Now the Top Earners in the Nation
- Insights New York City’s New Regulations Give Us about California’s AB5
- What Drivers Take Home After All Expenses Accounted For
- Our Take
- Why Uber Has to Pay More in Driver Incentives
- What are the Biggest Contributors to the Pay Increase?
- Methodology
Introduction to the RIDES Survey
The RIDES driver earnings survey is different from other surveys in that instead of relying on drivers’ word about how much they earn, we looked at hundreds of earnings screenshots from the earnings page of people that drive with Uber.
Specifically, we look at the earnings page that shows what drivers earned in the week prior to the week we surveyed them.
By utilizing this method, we not only avoid any inaccuracy on the part of drivers who might not remember correctly what they earned, but we are also to able to get a detailed breakdown of the various components that make up a driver’s total earnings.
For instance, we can see the exact amount of tips each driver earned, we can see how much Uber paid in driver incentives and bonuses.
And importantly, we can see exactly how many hours drivers worked which makes it possible for us to calculate an accurate average hourly income figure.
If you’d like to learn more about the specifics of how this survey was conducted, check out this section where we explain in more detail.
Survey Highlights
- New York City has become the best-paying city for Uber drivers in the wake of the city’s passage of new TLC regulations mandating a pay floor and encouraging cutbacks on the number of drivers.
- Uber drivers nationally, experienced a 31.4% increase in earnings when all levels of Uber’s various car services are included.
- Uber X drivers experienced a 38.46% increase in earnings.
- Uber is paying more in driver incentives and bonuses which may be cutting into their bottom line.
- Drivers give a grade of 2.71 stars to Uber’s corporate leadership, down from the 2.9 stars they gave them a year ago.
Survey Summary
Earnings Results

Net Hourly Earnings – Including Tips and Bonuses
| 2018 | $14.73 |
| 2020 | $19.36 |
These figures include the combined earnings from all classes of Uber’s services in one overall earnings figure.
This includes service levels such as Uber X, XL, Select, Black and SUV.
The net increase in pay over our 2018 survey represents a 31.4% increase for drivers – when looking at the combined totals of all service levels.

| Net Hourly Earnings | With Tips | With tips and with Uber’s Driver Incentives | |
|---|---|---|---|
| 2018 | $13.70 | $14.73 | $14.73 |
| 2020 | $16.47 | $17.79 | $18.97 |
The chart above shows the average hourly earnings for Uber X drivers only.
These numbers give a clear picture of how much tips and Uber’s driver incentives add to hourly earnings for X drivers.
Hourly earnings are up 38.46% for Uber X drivers.
Uber X is the most popular and widely used of Uber’s services.
Most Uber drivers drive exclusively for Uber X.
Uber X also pays drivers the lowest rates per mile and per minute.

| UberX | UberXL | Uber Select | |
|---|---|---|---|
| 2018 | $13.70 | $14.84 | $14.85 |
| 2020 | $18.97 | $19.89 | $17.21 |
These are the total earnings figures (including tips and incentives), for the three most popular service levels.
Interestingly Uber Select drivers made less per hour than Uber XL and Uber X drivers.
Uber Select is a high-end more expensive service for passengers to use.
The most likely reason these drivers earn less is because they get fewer trips, due to the higher costs for passengers and the fact that Uber does little to nothing to promote the Select service.
Tips Nudged up Half a Percent but Still in the 7% Range
| Year | Tipping |
|---|---|
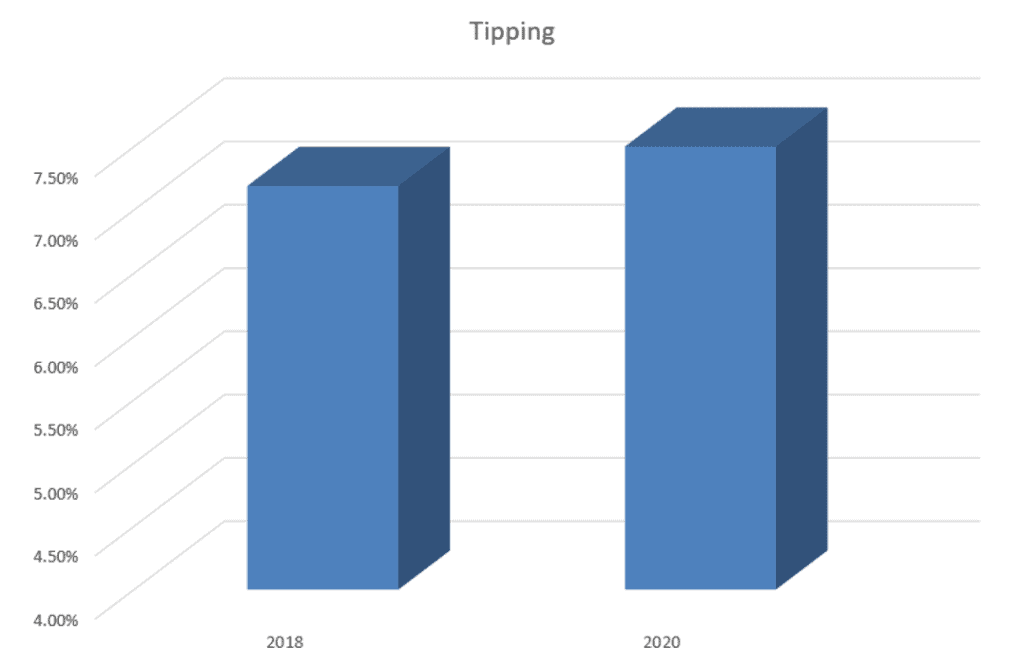
| 2018 | 7.19% |
| 2020 | 7.72% |
When Uber first allowed in-app tipping in 2017, hardly any passengers left tips.
Drivers thought riders just needed a little time to learn tipping was in the app before they would start tipping more generously.
However, in year two, riders barely budged in their generosity.
Apparently still under the impression that tipping isn’t necessary (or perhaps not warranted), they still tip on average in the 7% range.
- Average tips for Uber drivers: 7.72% compared to 7.19% in 2018
- On average, tipping added just $1.31 per hour to drivers’ earnings, compared to $1 in 2018.
Driver Sentiment
In addition to earnings, we also surveyed drivers to get a sense of their morale and attitudes toward the company.
This is the second year we’ve asked these questions, so we can establish a trend and found some very interesting results.
In our last survey, Dara Khosrowshahi had just taken over as Uber’s CEO several months earlier.
Drivers showed more optimism then that things would improve than they did this year.
Below: This year drivers rated the job Uber’s leadership team is doing at 2.71 stars.
That’s down from 2.9 stars in our last survey.

Below: In our last survey, drivers were relatively upbeat and hopeful about the changes Khosrowshahi might bring to Uber.
However, in the following year and a half, their sentiment seems to have soured.

Only 10.7% of drivers said their opinion is more positive now.
Uber lost ground on this question over the last year and a half.
This is less than half of the 22.8% of drivers who said their opinion was more positive in our last survey.
89.21% said their opinion was either unchanged or more negative.
This is up from 77.2% in our last survey and isn’t good news for Uber.
This represents a relative failure on the part of Uber’s CEO to effectively convey to drivers that Uber is a good company to work for.
The Best and Worst Earning Cities
Top-5 Cities for Earnings
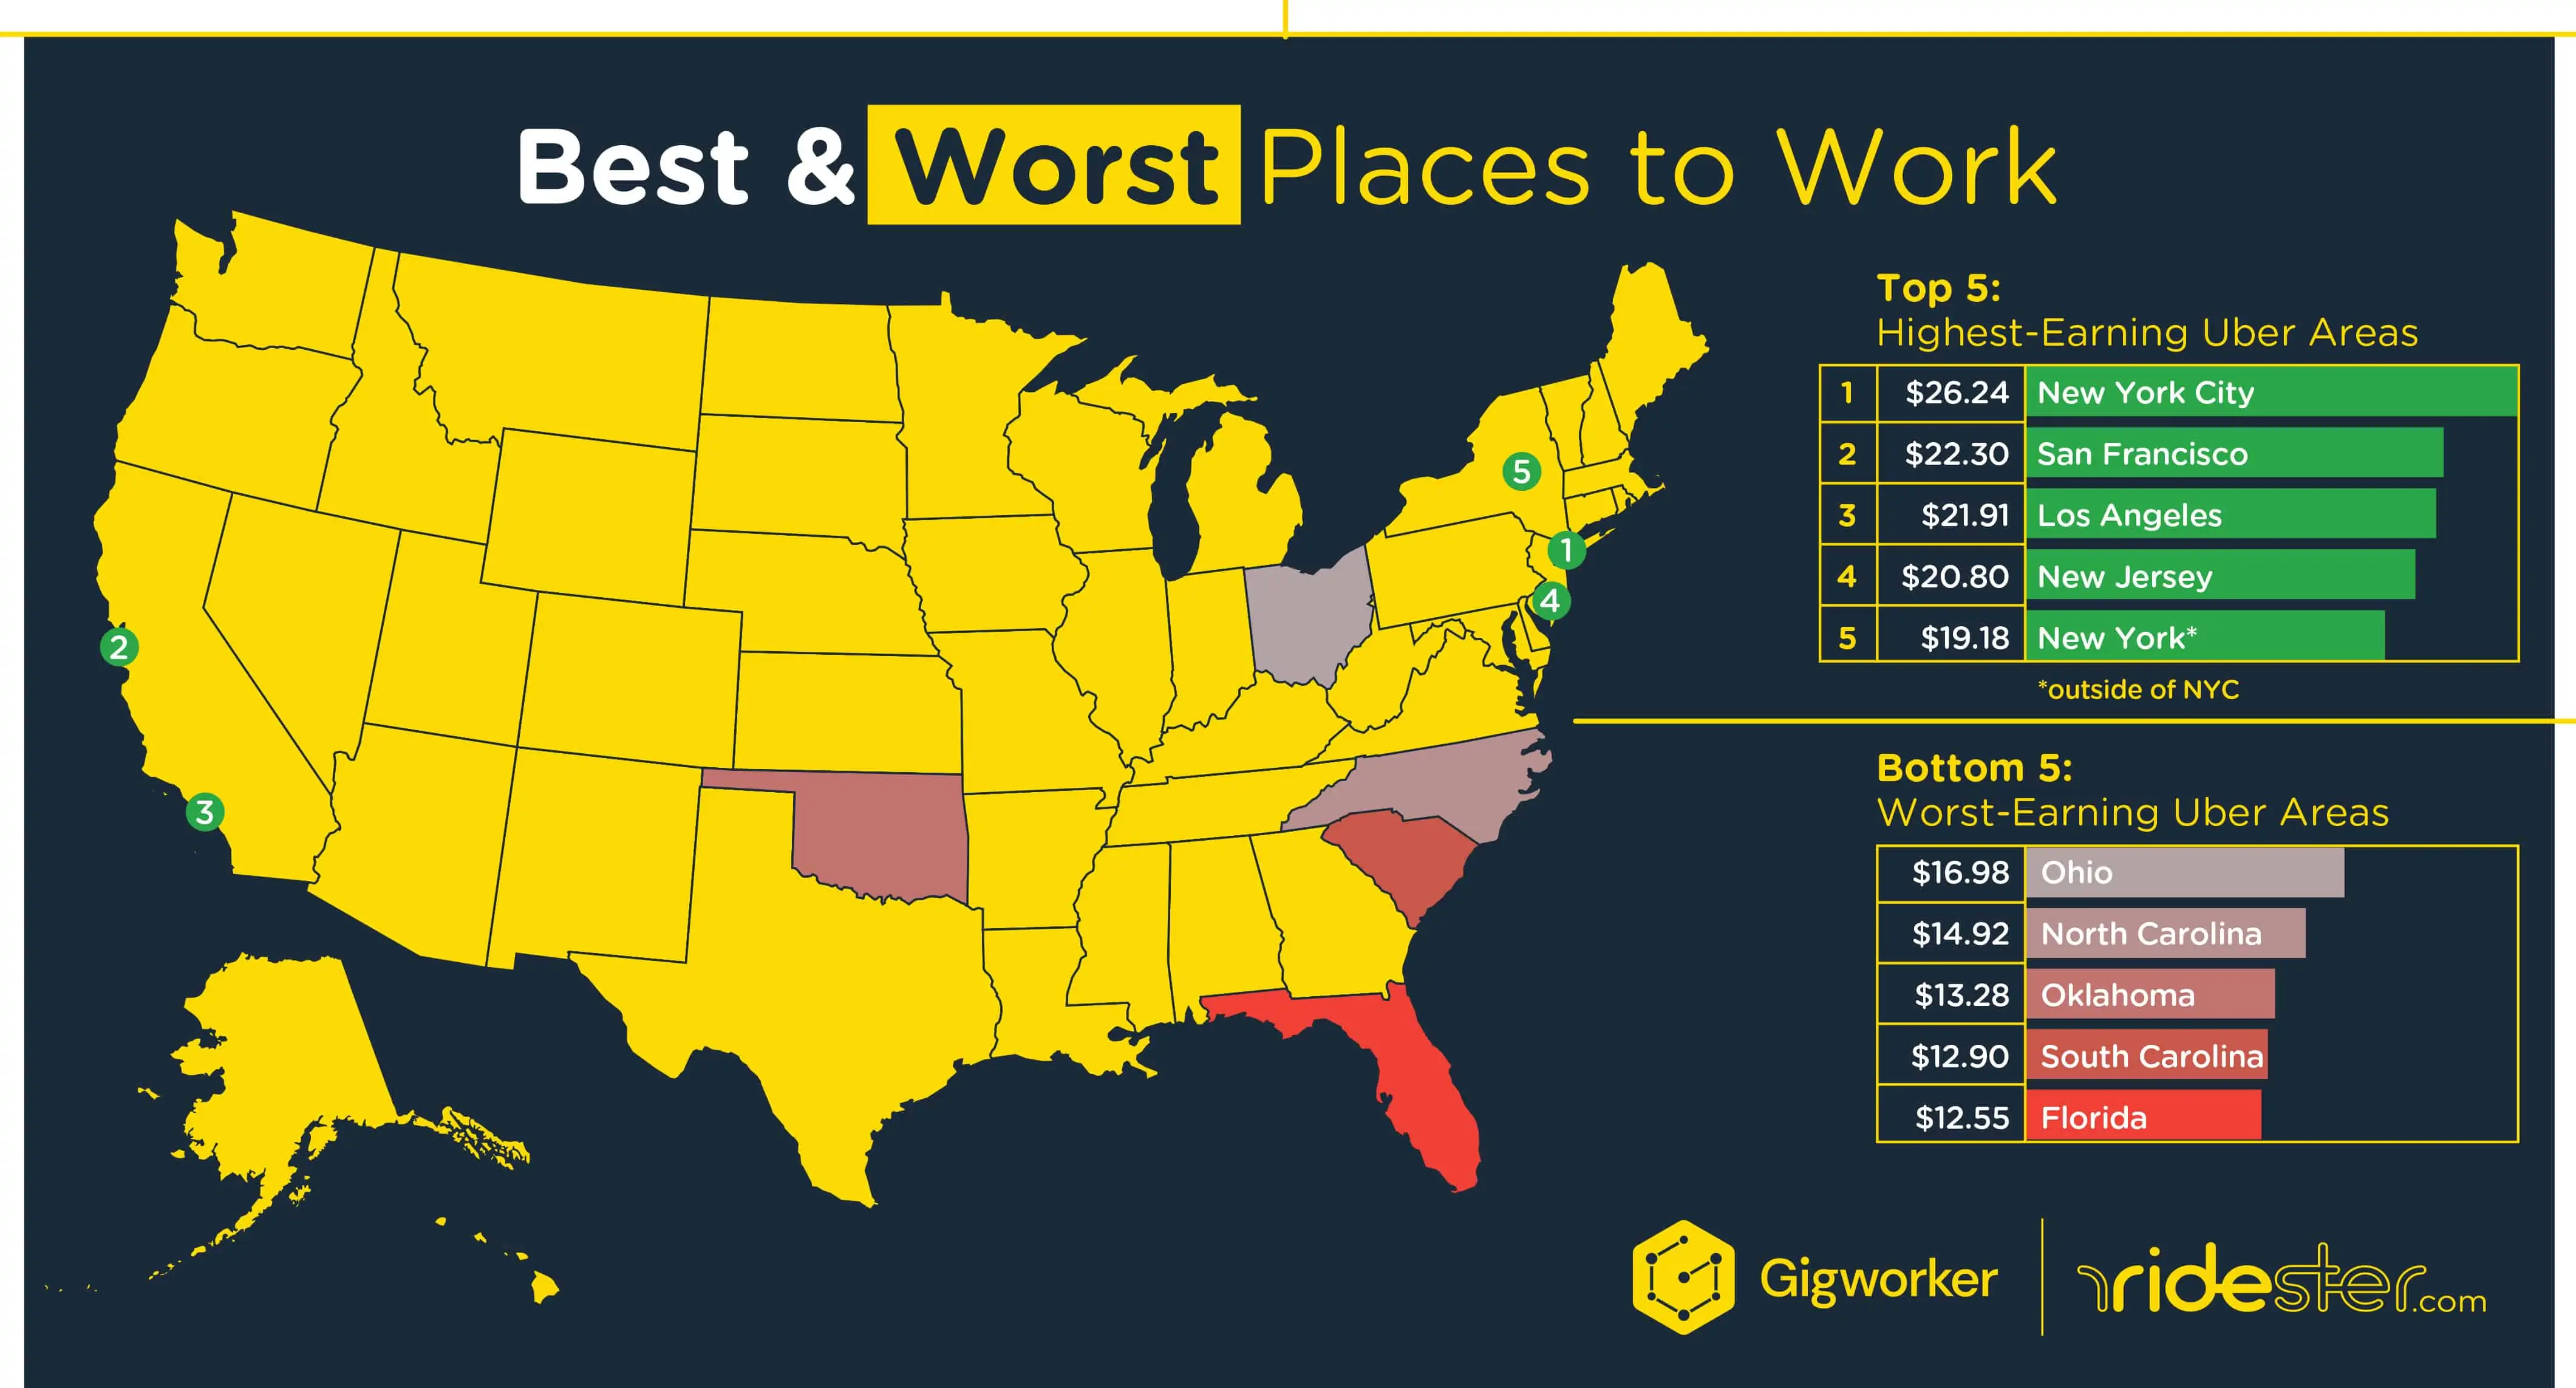
Here is how much Uber drivers made per hour in the top five cities for earnings:
- New York City – $26.24
- San Francisco $22.30
- Los Angeles – $21.91
- New Jersey $20.80
- New York state (outside of NYC) $19.18
Worst-Earning States
These are the bottom five states for driver earnings:
- Ohio $16.98
- North Carolina $14.92
- Oklahoma $13.28
- Florida $12.90
- South Carolina $12.55
NYC Drivers are Now the Top Earners in the Nation
In February 2019, a new and innovative regulation took effect that was passed by the city’s Taxi & Limousine Commission (TLC).
It marked the first time a city has regulated wages for drivers – while enabling them to remain independent contractors.
New York City drivers are now earning $26.24 an hour, which is nearly $4.00 an hour more than second-place San Francisco and 20% more than they earned before they new regulations went into effect.
As independent contractors, drivers aren’t protected under federal or state minimum-wage laws.
But New York City got around this by passing regulations through the TLC which regulates every aspect of New York’s taxis, for-hire vehicles and rideshare fleet.
These regulations use an innovative formula to raise driver pay and make more efficient use of the city’s entire supply of rideshare drivers.
The key to the formula is a system-wide “utilization rate” that changes the amount drivers are paid per minute and per mile by adjusting to how much work they are getting per hour.
While the formula may be a bit complicated to calculate it basically boils down to the fact that Uber and the other ride-hail companies in New York City have to pay each driver who is signed into the app a certain amount per hour whether they have any passengers or not.
This system has been successful in achieving the intended effects, which were higher pay for drivers and more efficient utilization of the same.
It has done this by incentivizing Uber, Lyft and Via to put fewer drivers on the road.
Now Uber only allows as many drivers as it thinks it can keep busy.
There are times in New York when drivers try to sign in and they are told that no more drivers are needed and asked to try again later.
While that hurts the drivers who can’t get onto the system, it helps the drivers who are already on.
Supply now more closely reflects demand which means drivers no longer have 10 or 15 minutes of idle time between trips waiting for their next call.
Now they will wait just a couple of minutes usually before getting their next trip.
If Uber can keep them busy for the full hour, then their wages will be more than covered by passenger fares and Uber can make a profit.
But if Uber can’t keep them busy enough, Uber has to cough up the money to cover the difference between what they’re owed and what the passenger paid.
It is now in Uber’s best interests to limit the number of drivers on the road to ensure that each driver who is online will stay busy, earn enough in passenger revenue so that Uber doesn’t have to chip in and subsidize their earnings.
The end result is that drivers are now apparently earning a living wage.
New York drivers are earning significantly more per hour than they did before this system went into effect.
They’re earning so much more in fact, that they are now the top earners in the nation – beating out second-place San Francisco by nearly 18%.
In our last survey, New York City came in as the sixth best-earning city in the nation.
Back then, New York drivers earned on average $21.92 per hour.
Today, at $26.24 an hour, they earn nearly 20% more per hour than they did then.
Insights New York City’s New Regulations Give Us about California’s AB5
Uber has responded to New York City’s regulations exactly as you would expect.
When faced with having to pay drivers whether they have paying passengers in their vehicles or not, Uber has done the rational thing and limited the supply of drivers to only what the demand can utilize.
AB5 differs from New York’s regulations in that, as proposed, it would make Uber drivers employees of the company.
New York’s regulations maintain drivers’ independent contractor status, while mandating an hourly earnings floor.
But the net effect of both laws is the same.
Uber will have to pay drivers an hourly minimum whether they have paying customers on board or not.
And Uber has shown in NYC that they will handle this by limiting the number of active drivers on the road.
For California drivers, this will certainly take a different form, but ultimately there will have to be fewer Uber drivers on the road.
Right now it costs Uber and Lyft nothing to have excess drivers tooling around hoping for a pickup.
But if AB5 is enforced on these companies, it will then cost them a great deal to have more drivers than they can keep busy.
You can be sure that whatever system they come up with, it will have the net effect of eliminating un-needed drivers.
Which in turn will all but guarantee that the drivers left standing will earn significantly more than they do today.
What Drivers Take Home After All Expenses Accounted For
When we did our first survey, we had to come up with a method to estimate actual driver expenses.
In April 2019 when Uber filed its S-1 in advance of its IPO, they also came up with a method to estimate driver expenses and the method they used was nearly identical to the same method we used.
So we feel pretty comfortable that these expense figures are fairly accurate.
On page 166 of their S-1 filing they concluded that real driver costs come to $0.75 per mile.

From our past survey work, we know that on average, an Uber driver will put between 10 and 20 miles on their vehicle every hour.
This gives us an average expense of between $7.50 and $15 per hour which has to be deducted from the earnings figures here to get a more realistic sense of how much drivers are really making after their car expenses are factored in.
And these car expenses must be factored in because they are, in fact, fixed expenses.
They aren’t optional.
Every mile a driver drives has certain fixed and variable costs associated with it.
Our Take
It seems that Uber is paying more this year than ever before in driver incentives.
Driver incentives are separate from and in addition to the driver’s portion of the fare paid by the passenger.
In other words, these incentive payments are in excess of what the rider’s fare covers.
These incentives and bonus payments come straight out of Uber’s share of the fare and may even go above and beyond what the rider actually paid in some cases.
In Uber’s April 2019 IPO S-1 filing with the SEC, they speculated that one of the risks to the business was that they might have to increase driver pay to levels higher than passenger revenue would cover.
In the SEC filing they stated that, “Excess Driver incentives refer to cumulative payments, including incentives… to a Driver that exceed the cumulative revenue that we recognize from a Driver with no future guarantee of additional revenue.”
Based on this year’s survey results, we believe they have reached a point where higher pay through driver incentives has become necessary.
And we believe this will put downward pressure on Uber’s fight for profitability.
Higher driver incentives mean less per-trip profit for Uber and perhaps even losses on more trips.
So, while these incentives are good for drivers’ bottom lines, they are not good for Uber’s.
Driver incentives represent what Uber has to pay in order to keep enough drivers on the road. Uber, of course, knows at which pay level the churn rate becomes unacceptable and when it reaches that rate they have to increase pay to drivers so that they are not losing more than they can recruit.
CB Insights says that only “about 20% of drivers remain on Uber’s platform after one year.”
And The Information has reported that their monthly churn is about 12.5%.
With a worldwide driver force between three and four million that means they have to recruit around 400,000 new drivers each and every month just to stay even.
CB Insights estimates that is costing the company roughly $1 billion a year.
Driver Sentiment – it may be legitimately asked why drivers’ opinions about Uber went down while their earnings went up.
Drivers we talked to indicated that while their earnings had indeed gone up, they felt it was harder and more stressful to achieve those higher earnings.
They also felt that Uber was manipulating them more than before with its system of incentives and bonuses.
Drivers now have to jump not only through more hoops but through more difficult hoops to achieve the higher earnings.
To earn the bonuses and incentives they have to submit to an ever-increasing set of demands from Uber.
That has made drivers feel not only manipulated but mistreated as well.
In the end it made them feel like nothing much has changed under Khosrowshahi.
They view it as the same “greedy” company that abuses drivers in order to make a buck as it was under Travis Kalanick.
Why Uber Has to Pay More in Driver Incentives
In our last survey, we found that most drivers were making well under $10 per hour after car expenses were factored in.
This is the primary reason Uber loses so many drivers so quickly after they sign up.
New drivers aren’t sure how well they’re going to do driving for Uber but they’ve heard stories, both good and bad, and decide to give it a try.
But it’s not long before they realize they really can’t make ends meet after car expenses are taken into consideration.
Drivers may not realize at first that they’re only netting around $10 per hour, but after a few months it becomes clear as it gets more and more difficult for them to pay their expenses.
We believe that’s why this year’s survey shows a fairly significant increase in driver incentives and bonuses.
We believe, based on our 2020 survey results, that the increase in pay in this survey compared to our last survey shows that Uber realized that driver pay had reached such low levels that they were unable to retain a sufficient number of drivers to keep the business functioning smoothly.
It appears that Uber has added, on average, approximately 8% to drivers’ hourly earnings in the form of bonuses and incentives since our last survey.
What are the Biggest Contributors to the Pay Increase?
In 2019 Uber restructured its rates in many cities.
They sometimes increased by significant margins the amount they pay drivers per minute, while simultaneously slightly decreasing the amount they pay per mile.
That seems to be the largest contributor to the pay increase because pay is higher even before we get to the bonuses.
We believe this may have had the effect of increasing earnings for the many drivers who work in urban areas who typically complete short trips in more time than drivers in outlying areas, because of urban traffic and heavy congestion.
The increase in the per-minute rates would have contributed substantially to their earnings.
But apparently, even that increase was not enough to hold onto drivers so they’ve had to add another 8% in the form of incentives and bonuses.
They may be getting their money’s worth on this form of incentive, however, because it allows them to have much tighter control over when, where and how drivers work on the platform.
It even increases driver loyalty because they have to stay on the platform longer to achieve the bonuses.
That means less driving for other companies.
Methodology
This survey was conducted over the three-month period from November 2019 – January 2020.
There was a total of 625 responses from Uber drivers across the United States.
We collected screenshots from drivers’ Uber app that showed how much they earned in the week prior to the week we surveyed them.
A financial incentive of $5 was offered to roughly half of the drivers who took the survey.
No incentive was offered to the other half.
Drivers were solicited online, through email and social media.






Informative article. I drive exclusively for Lyft. My assumption is that the facts are reflective of the industry. Thank you for your work.