In one of the largest independent surveys of ride-hail drivers to date, the Ridester team polled 2,625 rideshare drivers to measure income and driver satisfaction.
Our team’s approach to this campaign stands out from other surveys and gives us a unique insight into what drivers are actually making, based on real driver income data.
The results are fascinating, which we’ll outline in the article below.
Jump to:
Survey Summary:

Introduction to the RIDES Survey
In 2014, Uber with much fanfare, announced to the world that the median income for its New York City drivers was $90,766 a year.
This meant that half of all Uber drivers made less than that number, and the other half made more.
But after some effort on the part of several media organizations, it appeared difficult to find many drivers who actually made that much.
Despite the crazy bonuses companies in California are giving away, such as Uber driver guarantees and special sign up bonuses, reports of drivers making close to that income amount were rare.
In the years since, Uber and Lyft have kept mum on driver income – most likely because Uber settled a $20 million charge by the Federal Trade Commission in 2017 over allegations that it misled prospective drivers with fraudulent inflated income claims.
In the vacuum of reliable and independent information about driver earnings that existed then and now, there have been several attempts to fill the gaps undertaken by various driver-affiliated groups that have not provided much more than a guestimate of driver earnings.
These surveys have typically been conducted with around 1,000 driver respondents and they have relied exclusively on drivers self-reporting their income.
The 2018 Ridester Independent Driver-Earnings Survey (RIDES) is based on 2,625 driver respondents, including screenshots of driver earnings from 719 drivers.
This makes it one of the largest and most comprehensive independent driver earnings studies undertaken to date.
The primary goal of our survey was to minimize the uncertainty over self-reported income claims by drivers.
Past studies have simply asked drivers how much they make without providing any proof of that income.
But… it is a well-known phenomenon of surveys that people will exaggerate or underreport their earnings for a variety of reasons.
Because of this, we didn’t feel that self-reporting was the best way to measure driver earnings, so found a better way.
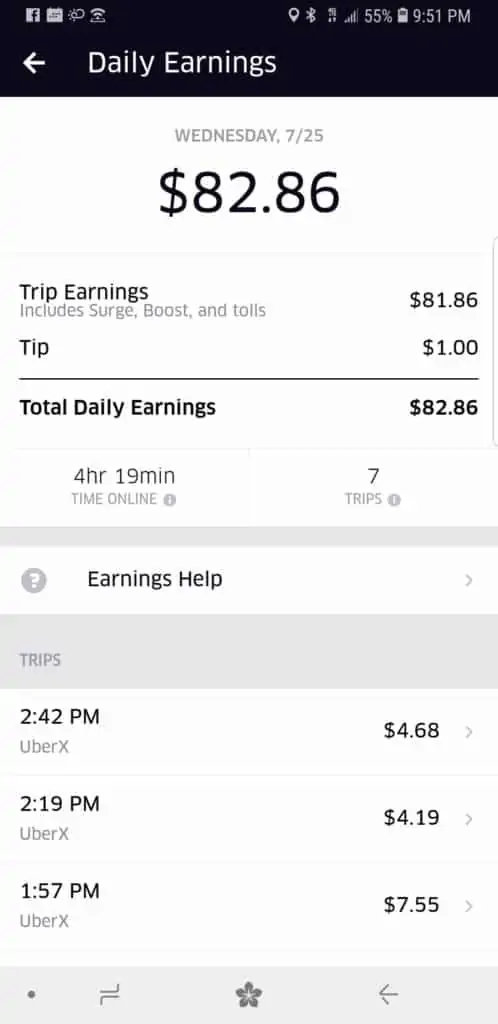
Instead of relying on drivers to accurately self-report their income, we asked them to provide evidence of their income by sending screenshots of their earnings page from the driver app.
These screenshots provide a wealth of data that makes it possible to draw the most accurate picture of Uber driver earnings to date.
Along with an accurate reporting of net pay to drivers, these screenshots also show the number of hours each driver was online when they earned the reported amounts.
They also show how much drivers earned or didn’t earn in tips.
So, for the first time we’re able to take a look at how riders are adjusting to tipping since Uber first introduced the option a little more than a year ago in June 2017.
Based on the data collected, we can see a better picture of how much drivers are actually making in 2018.
Survey Highlights
- This is the first survey to measure Uber drivers’ earnings by obtaining anonymous screenshots of the earnings page from the driver app.
- Uber paid our uberX-driver respondents a median net income of just $13.70 per hour. When rider tips are added to what Uber pays, the median rises only to $14.73 per hour.
- Drivers self-report income that is 37.40% higher than they were able to show with screenshots of their earnings.
- Drivers gave a grade of 2.9 stars to Uber’s corporate leadership
- Drivers also rated Uber 2.9 stars on earnings satisfaction.
- Dara Khosrowshahi received some good news in that 22.8% of drivers say their opinion of Uber is more positive now since he took the reins.
- 58.3% of our driver respondents are over 50 years old.
- 55.1% of our respondents reported having a college education. 10.7% reported having post-graduate degrees.
- Nearly 70% of our respondents are Caucasian (69.7%). Latinos make up the next largest group at 11.6% and Black/African Americans make up the third largest at 9.4%
- 88% of our respondents reported being American citizens while just 12% reported being foreign-born. Out of those who were foreign-born, the largest group of drivers by country of birth was from the Philippines (8.7%). The second largest group was from Mexico (6.7%).
Methodology
The RIDES survey was taken over a two-and-a-half-month period between May and July of 2018.
The survey was promoted to gig workers that drive with Uber through a variety of driver-oriented websites, forums and groups.
The survey took approximately 6-7 minutes to complete, and drivers were not offered any financial incentive to participate.
Of the 2,625 total responses we received, we analyzed 2,603 self-reported driver earnings declarations – totaling $1,027,585 in driver earnings and representing 62,583 paid driver hours.
Drivers were qualified by the question: “Have you driven for Uber or Lyft either part-time or full-time within the last 6 months?” Anyone who said they had not driven in the last six months was automatically dropped out of the survey.
The RIDES survey is likely far more accurate than past driver earnings surveys because we did not simply ask drivers to tell us how much they made – we asked them to show us.
This provides a high level of confidence in the overall results.
We attempted to lead drivers to give us the most accurate picture of driver earnings possible by taking them through a series of questions:
1. Self-report earnings
First, we asked drivers to self-report their earnings.
However, we didn’t do so by simply asking them to give us their opinion on how much they thought they earned.
We instead asked them to look at their driver app and tell us how much the app reported that they earned.
This, we thought, made it much less likely that drivers, who may have been prone to over or underreport their earnings, would do so because they would have the correct figures right before them. (But we were proven wrong when the screenshots came in)!
Here’s how we worded the first earnings question:

2. Self-report hours worked
Next, we asked them to do the same with their hours worked.
We didn’t ask for their opinion on how many hours they thought they worked.
We asked them to tell us how many hours the app said they worked.

3. Verify self-reported numbers
Last, in order to confirm the self-reported earnings, we asked drivers to submit a screenshot of the earnings page they just referred to.
928 drivers submitted screenshots and out of those, 719 were usable, (i.e. they submitted the correct screenshot that showed their earnings information).

Below is a typical example of an earnings screenshot we received:
Outcome
Even as we walked drivers so carefully through this series of questions, their self-reported average earnings came in 37.01% higher than their screenshots showed.
(We specify average earnings here rather than median earnings so this result can be compared to past surveys by other organizations – which reported average income rather than median income.
We’ll talk more about that in a minute).
Of the 2,625 respondents, 928 provided screenshots from their Uber or Lyft driver apps.
Of the 928 submitted screenshots, 719 met our standards and were usable.
The screenshots of actual driver earnings allowed us to view and analyze driver trips that accounted for $81,970 in income, representing 5,244 paid driver hours.
At the heart of our inquiry, was a desire to get a true picture of hourly driver earnings.
Our goal was to come up with figures that we could have a high level of confidence in and we believe we have done that.
By walking drivers through this series of questions and by requesting screenshots of their earnings, we avoided getting answers that reflected:
- their opinion of what they made;
- their best recollection of what they made;
- what they wish they had made;
For example, a Lyft driver who just claimed a $2,500 signup bonus is less likely to report low earnings, like a driver consistently making less than $15 an hour would.
One additional thing to note is that we made no real attempt to distinguish between Uber and Lyft driver earnings.
Uber and Lyft’s rates are almost identical in most cities around the country and their customer bases are almost identical as well.
So, we assumed that driver earnings are virtually identical regardless of the platform drivers work for.
With that said, approximately 95% of the screenshots we received were from Uber drivers.
Average vs. Median Income
Typically, when it comes to measuring income and earnings, statisticians will present the median income rather than the average income.
You’ll often see news reports that show the “median income” for a particular group of people.
That’s because in dealing with income, an average can be skewed significantly by outliers – numbers that are either significantly higher or lower than what most people in the group are earning.
For example, if you have 30 people who each make $35 per hour based on current Uber rates or fare prices, you can accurately say the average income among those 30 people is $35 per hour.
But if you add one person to the group who earns $1,000 per hour, the average skyrockets to $66 per hour.
But the first 30 people don’t earn anything close to $66 per hour so the average does not always give a clear picture of what most people in a group earn.
The $1,000 outlier greatly skewed the results and makes it appear as if the other 30 people earn almost twice what they really earn.
However, the median income of 30 people who earn $35 per hour plus one person who earns $1,000 per hour is $35.
The median income figure puts you closer to what most people in a group earn without being unduly influenced by outliers that are significantly higher or lower than what most people earn.
But before we get to earnings, let’s look at a few other highlights from our survey.
We Distinguished Drivers by Service Levels
Past independent driver earnings surveys have not been specific about what exactly they’re reporting.
Their reports usually begin with something like, “Uber drivers earn…” as if there is only one kind of Uber driver.
However, there are several kinds.
There are the ubiquitous uberX drivers, then the slightly less ubiquitous uberXL drivers.
There are also people who drive for uberSELECT, uberBLACK, uberSUV, uberLUX, and Uber Eats.
All of these are higher paying services than uberX, but their incomes are typically thrown into the mix with uberX drivers – making it appear as if uberX drivers are making more than they actually are.
Our survey took this discrepancy into account, and broke down earnings between the various service levels, starting with uberX and including uberXL and uberSELECT.
When we say, “Uber drivers earn…” we mean uberX drivers.
We did not mix drivers from different service levels together because that does not give an accurate picture of what the vast majority of Uber’s driver workforce, the uberX driver, earns.
Previous surveys have also not always been clear about what earnings they’re reporting.
Gross earnings, net earnings after Uber’s fees, or commission, have been deducted, or net earnings after fees and driving expenses? They don’t always say.
We are reporting net earnings, after Uber’s fees and commissions have been deducted.
We are reporting the actual income drivers are paid by Uber.
And we are reporting this before taking into account all of the associated fixed and variable car expenses drivers incur each hour they’re on the road.
We Accounted for Tips
Even though Lyft has encouraged tipping for years, Uber only began facilitating tipping through the rider app in the summer of 2017.
Our RIDES survey is the first that we’re aware of that will report on tipping.
We were able to factor tipping into the earnings data because we received hundreds of screenshots from drivers around the country showing their earnings page from the Uber and Lyft apps.
Most of the screenshots we received also showed how much each driver made in tips.
So, we were able to analyze that data and come up with a clearer picture of how much drivers are earning in tips.
Survey Results
Before we asked drivers to give their opinions on working for Uber, we asked them if driving is their only job or if it is supplemental to other work.
The response was split nearly perfectly 50/50.
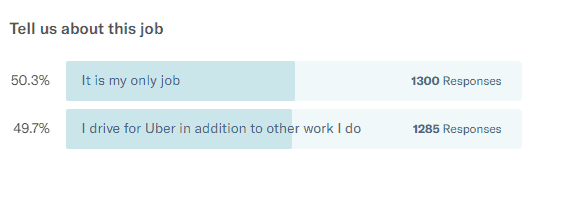
As politicians and courts continue to make decisions on employment and safety-net policies for gig economy workers, they will have to consider the possibility that for half of all gig economy workers, it may be their sole job.
Driver Satisfaction and Opinions of Uber
We then asked our driver respondents to do unto Uber as Uber has done to them and rate Uber on a scale of 1-5 stars in terms of how satisfied they are with the amount of money they’re earning.
Our drivers gave Uber 2.9 stars on this score.
A full 70.7% of our respondents gave Uber 3 stars or less.
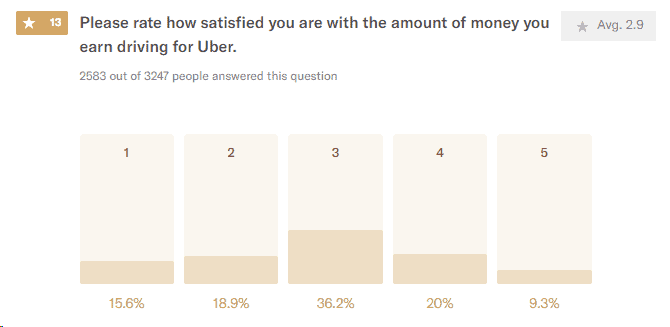
- 70% of drivers rated Uber 3 stars or less on earnings satisfaction
- 5-stars 9.3%
- 4-stars 20%
- 3-stars 36.2%
- 2-stars 18.9%
- 1-star 15.6%
We then asked drivers to rate Uber’s corporate leadership in terms of how good a job they think they’re doing.
Again, drivers gave Uber a grade of 2.9 stars, on a scale of 1-5.
Two thirds of drivers (66.5%) gave Uber a rating of three stars or less.
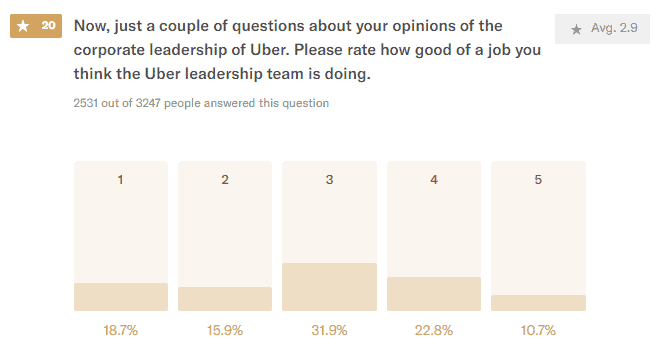
- 66.5% of drivers rated Uber’s Corporate Leadership 3 stars or less on corporate leadership
- 5-stars 10.7%
- 4-stars 22.8%
- 3-stars 31.9%
- 2-stars 15.9%
- 1-star 18.7%.
But when we brought Dara Khosrowshahi’s name into the mix, things seemed to take a bit of a turn for the better for the new-ish CEO.
We asked drivers if their opinion of Uber’s leadership had changed since Dara Khosrowshahi took over as the new CEO last year.
22.8% said their opinion of Uber’s leadership is now more positive since Khosrowshahi took over. 67.2% of drivers either said their opinion hasn’t changed and 10% of drivers said their opinion is now more negative.
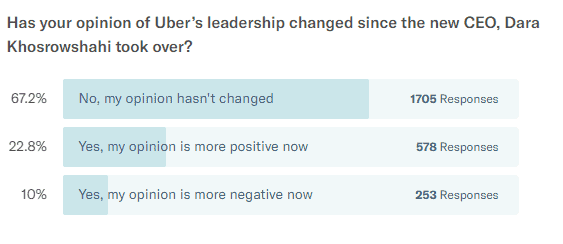
- 67.2% said their opinion of Uber hasn’t changed
- 22.8% say their opinion is more positive
- 10% say their opinion is more negative
On the other hand, it would be reasonable to assume that most of those who said their opinion hasn’t changed most likely had an at least somewhat negative opinion in the first place, so Dara still has his work cut out for him.
In addition to the above question, we asked our respondents if they believed Uber as a company is heading in the right direction.
The yeses and noes were pretty evenly split.
29.7% said no and 30.5% said yes.
39.8% said they don’t know.
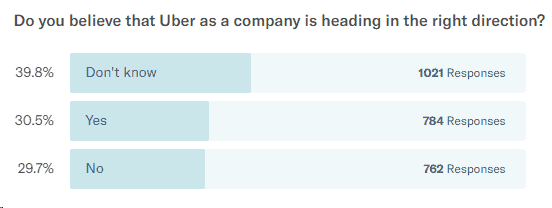
- 39.8% Don’t know if Uber is headed in the right direction
- 30.5% Yes
- 29.7% No
So, there are still a large number of drivers who can be swayed, but once again, Dara has his work cut out for him.
The category in which Uber ranked highest with drivers, was when it came to Uber’s driver support service.
Uber achieved 3.1 stars here.
Still not a perfect rating, but for Uber it’s better than they did in the other categories.
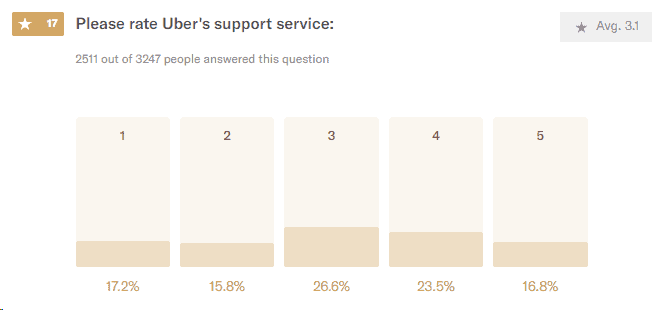
- 59.6% gave Uber 3 or fewer stars on Driver Support
- 5-stars 16.8%
- 4-stars 23.5%
- 3-stars 26.6%
- 2-stars 15.8%
- 1-star 17.2%
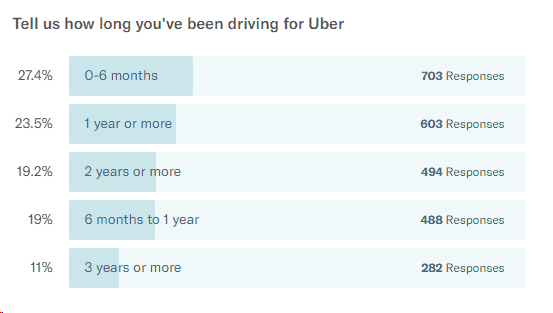
Our survey confirms what has been widely acknowledged – that Uber’s attrition rate in 2018 is still extremely high.
Almost half of all drivers are still giving up before they complete their first year.
46.4% of respondents said they had been driving for Uber less than a year.
And just slightly over half – 53.5% – said they had driven for more than a year.
Driver Earnings by Service Level
The RIDES survey sheds light on driver satisfaction over earnings and gives detailed earnings insights.
Here, we will report the median income figures for the various service levels for which we received enough responses to feel confident in the figures.
We will also show side-by-side what drivers reported earning and what their screenshots showed they actually earned.
When we say “service level” we’re talking about the different levels of service Uber offers.
Many people aren’t aware that Uber offers more than one service, and are primarily cognizant of the ubiquitous uberX.
But Uber has several more levels of service, each charging progressively higher rates than uberX.
Listed in order from lowest to highest paying, the most common services are:
- uberX
- uberXL
- uberSELECT
- uberBLACK
- uberSUV
- uberLUX
There are several other services which didn’t play any noticeable role in our survey, such as uberEATS, uberWAV and Uber Car Seat.
But before we dive into the earnings figures, here is how the service levels broke down in terms of percentages of respondents driving for each one:
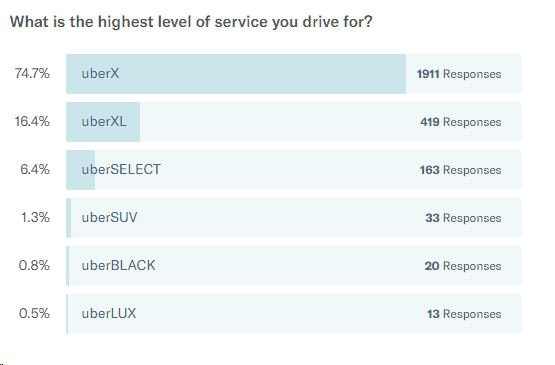
Self-reported earnings from drivers from all the service levels combined, showed that drivers earned a median income of just $14.46 per hour.
This is net income which is what drivers reported being paid after Uber’s commissions were deducted.
This figure does not take into consideration driver expenses, which must be taken into consideration because they are not optional.
There are very real expenses that each and every driver incurs every time he or she drives for a ride hail company.
We will take a more in-depth look at the end of this report.
By way of comparison, the net income drivers reported to us, averages out to: $16.42 per hour.
This figure can be compared to past surveys from other organizations that used income averaging instead of reporting median income.
And it can be compared to those surveys which did not distinguish earnings among the various service levels.
uberX (74.7% of respondents)
- Self-Reported Median Income: $14.22
- Screenshot Median Income: $13.70 (before tips – see the next section on Tips)*
uberXL (16.4% of respondents)
- Self-Reported Median Income: $15.48
- Screenshot Median Income: $14.84
uberSELECT (6.4% of respondents)
- Self-Reported Median Income: $13.89
- Screenshot Median Income: $14.85
uberBLACK (0.8% of respondents)
- Self-Reported Median Income: $16.67
- Screenshot Median Income: $24.87**
uberSUV (1.3% of respondents)
- Self-Reported Median Income: $10.93
- Screenshot Median Income: $25.38**
*Tips
When considering income, we are reporting pre-tip income.
That’s because tip income was negligible in the majority of cases.
36% of all drivers reporting, didn’t earn any tips during the period their earnings screenshots covered.
And 54.1% of drivers earned less than $5 in tips during the period their earnings screenshots covered.
Among the drivers who did receive tips, we found that the median tipping percentage was just 7.19%.
The Best and Worst Earning Cities
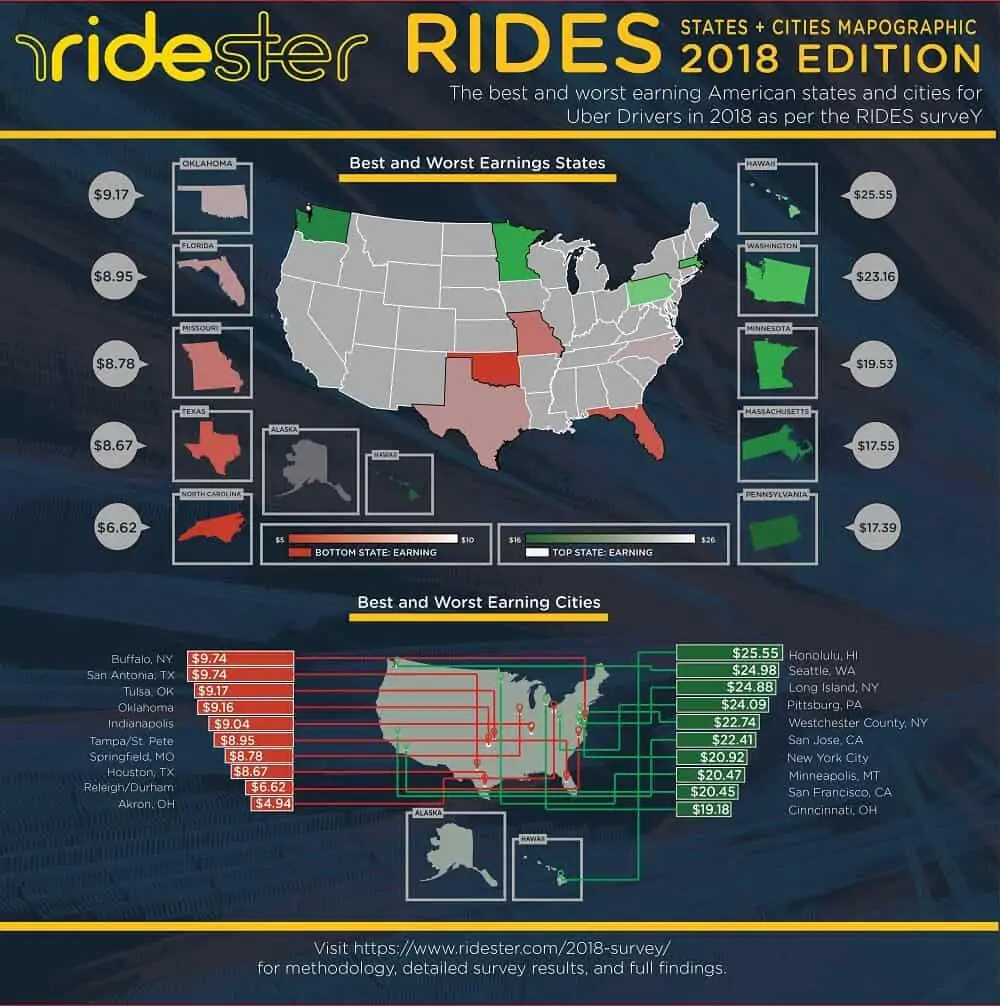
Top Ten Best Earning Cities
The best and worst cities to drive in – in terms of median hourly earnings are:
- Honolulu – $25.55**
- Seattle – $24.88**
- Long Island – $24.85**
- Pittsburgh – $24.09**
- Westchester County, NY – $22.74**
- New York City – $21.92
- San Francisco – $20.45
- San Diego – $18.00
- Chicago – $17.81
- Boston – $17.52
Bottom Ten Worst-Earning Cities
- Buffalo – $9.74
- San Antonio – $9.74
- Tulsa* – $9.17
- Oklahoma City** – $9.16
- Indianapolis – $9.04
- Tampa/St. Pete – $8.95
- Springfield, MO – $8.78
- Houston – $8.67
- Raleigh/Durham – $6.62
- Akron, OH – $4.94
Top Five Best-Earning States
- Hawaii* – $25.55
- Washington – $23.16
- Minnesota – $19.53
- Massachusetts – $17.55
- Pennsylvania – $17.39
Bottom Five Worst-Earning States
- Oklahoma** – $9.17
- Florida – $8.95
- Missouri – $8.78
- Texas – $8.67
- North Carolina – $6.62
**While these figures are in keeping with anecdotal evidence, they are based on a very limited number of responses.
A Word on Driving Expenses
Our survey adds to the mounting body of evidence that at least half of all Uber drivers earn less than $10 per hour after all car expenses are considered.
If you contact Uber, through any method, they’ll give you a roundabout answer, but our evidence holds true.
And car expenses must be taken into consideration because they are not optional for drivers.
Every mile a driver puts on his car costs something and that has to be accounted for in any attempt to assess how much drivers are really earning.
Researchers and pundits have agonized over just how much it costs a ride-hail driver per mile to drive.
While it is not possible to say exactly how much it costs any individual driver, that should not stop us from coming up with reasonable and reliable aggregate expense figures.
The IRS pegs total driving costs, including intangible but very real expenses such as depreciation, at 54.5 cents per mile for 2018.
Triple A puts the composite cost for all vehicles at 49.44 cents per mile.
For a medium-size sedan, similar to many uberX cars, Triple A puts the cost at 54.45 cents per mile for cars driven 20,000 miles per year or more.
This figure is strikingly close to the IRS’s figure.
For small sedans, which are also driven by many uberX drivers, Triple A puts the per-mile cost at 37.15 cents.
If we split the difference between Triple A’s expense figures for medium-size and small sedans, we come up with an average figure of 45.80 cents per mile.
For drivers who rent vehicles to use in ride-hail work, the rental costs are very much tied to the real costs of car ownership for the rental company.
uberX-qualified vehicles generally rent from around $200 to $400 per week – depending on the city.
If you assume drivers drive an average of 40 hours per week, then they are looking at $5 to $10 per hour in vehicle expenses.
And in a moment we’ll show that drivers who own their cars also incur somewhere between $5 and $10 per hour in vehicle expenses.
Since we now have a realistic median income figure for uberX drivers, and a firm idea of actual aggregate vehicle expenses for cars owned and operated on American roads, all that is left to figure out is how many miles on average, drivers drive per hour.
To do this, we looked at infinitemonekycorps.net’s City Speed project.
There we can find the average speed in which traffic moves in cities around the country.
For instance, in Philadelphia, we find the average speed of traffic is 20.3 miles per hour.
So, a person who is driving continuously would be expected to travel 20.3 miles on average each hour.
Since Uber drivers have to stop and wait for passengers though, we will assume they are completely stopped and waiting for a passenger 10% of each hour.
That means the average Philadelphia driver would travel approximately 18.27 miles on average each hour.
Since our survey breaks out earnings by city, we can look and see that Philadelphia drivers earn more than the $13.70 national median, coming in at $17.62 per hour.
But when we deduct the per-mile costs of $0.458 for the 18.27 miles we get an average hourly expense of $8.37.
That means the average Philly driver earns a median income of just $9.25 per hour.
Our Take
So there you have it.
We asked, and drivers answered.
But from a driver’s perspective, what does this mean? I’ll now give you my opinion on the results.
After seeing the results, to me it looks like drivers remain unhappy with Uber, and most of their dissatisfaction probably stems from low earnings.
It’s clear that drivers are going to have to be proactive and think outside the box to find creative ways to earn more money.
There is a glimmer of light, however, stemming from Dara Khosrowshahi taking over the helm last year.
While drivers’ opinion of Uber’s corporate leadership hasn’t improved dramatically since then, it has improved somewhat and we sense that they are willing to give Khosrowshahi a chance to show that his actions will live up to his words.
In a word, we would say they are hopeful.
Half of our driver respondents reported that their work for Uber (and Lyft) is the only work they do.
While many drivers make slightly more than their state’s minimum wage, after driving expenses, (especially in states with low single-digit minimum wages), a majority of drivers earn less than $10 per hour.
Considering that these drivers have no benefits whatsoever, no health insurance, no unemployment insurance, no disability insurance and no minimum wage protection, these drivers are risking everything to drive for the ride-hail giants.
These low earnings also put the public at risk in terms of safety.
Drivers who are just barely scraping by in life are not likely to put the kind of money into maintaining their vehicles that is required to keep them in a tip-top safe driving condition.
Think of the driver who is struggling to pay for a $300-a-month prescription drug for his wife.
He may have to choose between the life-saving drug and a new set of tires.
He will likely decide to keep the old worn tires for another couple of thousand miles before he replaces them – putting his passengers at risk every time he drives.
Same with brake pads and other key safety components that are subject to wear and tear.
Low driver wages put the public at risk.
Uber and Lyft could easily help drivers increase their earnings simply by putting a cap on the number of drivers they allow on the road at any one time and raising fares by a small percentage.
We agree with the conclusions of a study produced in July 2018 for the New York City Taxi & Limousine Commission which said, “Hourly pay is low in large part because the industry depends upon a ready availability of idle drivers to minimize passenger wait times.”
In other words, Uber and Lyft knowingly put more drivers on the road than they need so that each passenger can get a quick pickup with minimal wait time.
The study proposed a 5% fare increase and a reduction in the number of drivers which would lead to only a 12 to 15 second increase in wait time for passengers.
But these changes would also lead to a 22.5% increase in net earnings after expenses for drivers.







When I first started driving for Uber/Lyft I was making around 1.17 a mile this figure dropped to 0.74, then 0.59 and this year 0.26 a mile. This year I put over 80,000 miles and after vehicle and maintenance experience I will be cleaning ( -$1,000 ) during this coronavirus-19 pandemic – here in Phoenix Arizona. I believe that this algorithm is designed to help all drivers make the same – the other day I sat in an empty airport driver’s waiting area around Williams Arizona and the algorithm for drivers didn’t know it was closed or traveling limited air trips – the algorithm kept directing me to drive to the que – the algorithm directs drivers to hot-spots to make $3 tip for every rider but you could be there for a few hours before getting a$3 tip for a $7 fare. Today this algorithm sucks – I was making twice as much for the same trip last year then this year – I came to Phoenix to save up for my retirement at this point it might be better for me to drive a school bus? Oh I heard that by next July all driver platforms will be the same across the board – Uber black the same as Uber XL the same as Uber and so on. – I am a dedicated driver I drove and am driving during this coronavirus-19 pandemic – but what does the algorithm care it’s not alive?