
Whether you’re a long-time Uber or Lyft driver, or someone who is considering driving for the first time, the Ridester Driver Earnings Calculator is here to provide estimates of what you can earn in your city.
It will estimate how much you’ll earn with both Uber and Lyft, providing income figures for all platforms, including UberX, UberXL, UberBLACK, UberSUV, and the corresponding Lyft services.
If you’ve never driven for a rideshare company, getting an estimate will give you a good idea of how much you can earn.
And if you are a veteran driver, it can help demystify your actual income figures after expenses.
- Uber and Lyft Driver Income Estimator
- Getting the Most Out of the Ridester Earnings Calculator
- Getting the Best Estimate for the Higher-Level Services
- Sample Scenario
- The Real Benefit of the Driver Earnings Calculator
- How Much Do Drivers Make?
- What Goes Into How Much I Can Earn?
- A Look at Your Hidden Expenses
- Understand Uber Costs to Calculate Your True Driver Income
Uber and Lyft Driver Income Estimator
We’ve made it as easy as possible for you to find out how much you’ll make when driving.
Our calculator does all the hard work for you by automatically pulling in data for your city.
To get started, select a city then fill out the additional expense fields when prompted.
For best results, enter figures as close to real-world scenarios as possible.
The more accurate the figures you use, the more accurate your estimate will be.
Get an estimate now, or keep reading below for more information on the different variables for your estimate.
Sign up to drive and make money on your own schedule
– Become an Uber driver –
– Become a Lyft driver –
[ufv2_earning_calculator]
Getting the Most Out of the Ridester Earnings Calculator
Here are the variables the calculator will figure out for you:
- You tell it the city you’ll be driving in and it will automatically input Uber’s and Lyft’s mileage and per-minute rates for your city
- It assumes you’ll earn 75 percent of the mileage and per-minute rates for your city, but you can change that percentage if you know it’s different
- It will also automatically calculate your earnings for all the different vehicle types Uber and Lyft have
Here are the variables you’ll enter on your own:
The Number of Hours You Estimate You’ll Work Per Week
This variable is a great one to play around with because you can test it with different numbers of hours to get an estimate on how many hours you’ll need to work to make what you want to make.
The Number of Trips You’ll Drive Per Hour
This one is a little tricky and will take a lot of care on your part to get it right.
If you do get it right, you’ll get a very solid earnings estimate from the calculator.
If you don’t, the estimate could be way off.
To best way to get the most accurate figure for this variable will be to talk to other drivers in your city.
And one easy way to do that is to find an online forum where your city’s drivers meet up and discuss things.
Facebook has a lot of driver forums for different cities around the country and might be one place you could get this information.
Average Trip Distance
Like the number of trips per hour, this variable is equally important to getting a good result from the calculator.
If you’re already a driver, you should have a good idea of your average trip distance.
You can always look at your daily and weekly earnings to get an exact figure.
The more trips you look at, the more accurate this figure will be.
If you’re not a currently a driver, we’d again recommend the driver forums as a place where you can talk to other drivers in your city and get this information.
These two variables are a little difficult because each hour can be so different.
One hour you may get no trips.
Another hour you may get only one long trip.
And another hour you may get four back-to-back short trips.
So if you’re a current driver, the more of your past trips you can look at, the more accurate this will be.
It may surprise you, but the average number of trips per hour is probably lower than you think.
On a national average basis, drivers are averaging between 1.5 to 2.2 trips per hour.
Car Payment
This one seems self-explanatory, but this can differ between drivers.
Most drivers have purchased and financed their cars.
If that’s the case for you, then simply put in your monthly car payment and choose the “Per Month” option.
If you’re renting a car from a company that rents cars to Uber and Lyft drivers, and you pay weekly, then put in your weekly amount and choose the “Per Week” option.
Car Maintenance
In this field, you can put your normal monthly car expenses.
Don’t put your gasoline expense, though, as you’ll be asked for that in a separate field.
But in this field, you should include expenses like oil changes, car washes, and those kinds of things.
Other Car Expenses
This is a great field to use to input your estimated future major repairs expense as well as depreciation.
If we go with our estimate of $1,200 per year, we’ll put $23 (per week, which is $120 per month) here.
Now you’re covered for routine car maintenance expenses from the Car Maintenance field and long-term major expenses which you can estimate on a yearly basis and enter as a monthly average into this field.
We’re also going to add our depreciation expense here.
So, going by the example above, our depreciation is $448 a month which comes to about $103 a week.
Meals While You’re Working
This is easy to figure out even if you’re not yet a driver.
Just give a best guess as to how often you’ll eat and the price range of the meals you’re likely to eat while you’re driving.
Car Insurance
If you own or finance your car, simply put your monthly insurance payment in this field.
If you are renting a car for the specific purpose of driving for Uber and Lyft, and the insurance is included in your rent payments, then you can leave this field blank.
Gasoline
If you’re not a current driver, this should still be pretty easy for you to guess at and get pretty close to the real figure.
Phone Plan
Here you can enter the amount of your monthly phone bill.
But since you probably use your phone for other purposes as well, try to enter a percentage of the bill that you think can be attributed to your driving work.
For instance, if you use your phone 75 percent for driving and 25 percent for personal, then enter 75 percent of your monthly phone bill here.
Also, if you had to upgrade your data plan so you’d have enough data to drive for Uber and Lyft, then add the full difference between your old plan and the new one here.
Extras Costs
This is for those little extras you might include for your passengers while you’re driving, like water, snacks, or gum.
Depreciation
You’ll notice that there is no field here for depreciation.
That’s because it would be impossible for us to automatically input a realistic depreciation figure for your specific make, model, and year of vehicle.
So, using the depreciation numbers that we talked about above, you can put in your monthly depreciation figure in the “Other Car Expenses” field.
And don’t leave this out.
It is a major part of your real driving expenses.
Remember, just because you don’t have to pay it out of pocket every month doesn’t mean you won’t end up paying it eventually! It is a very real expense and should be included in your monthly expense figures for the most accurate earnings estimate possible.
Getting the Best Estimate for the Higher-Level Services
If you’re driving for UberX and you’d like to see how much you’d make if you could drive for UberBLACK, there’s something very important you have to keep in mind here.
When you drive for the higher level services, you’ll get fewer trips per hour.
It’s just basic economics — there is less demand for more expensive services.
So, factor that into your calculations.
If you average 2.5 trips per hour on UberX you’ll average possibly just one trip per hour on UberBLACK.
You may even average less than one trip per hour on BLACK.
You may only average 0.65 trips per hour on BLACK.
However, the calculator doesn’t let you enter anything less than 1.
So, if you have real-world experience and know that you’ll average less than 1 trip per hour on BLACK, then you can compensate for that in the calculator by telling it you get 1 trip per hour, but make the average trip distance a little shorter than it really is.
Don’t Make This Mistake
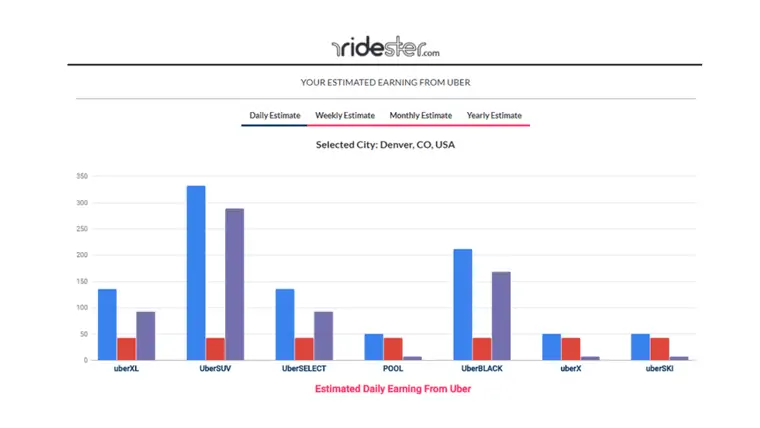
If you fill in all the variables to estimate how much you’d earn on UberX, the results page will show you how much you’d make for all the services: X, XL, BLACK, and SUV.
But, the number of trips you’ll get per hour on BLACK and SUV will be far lower than the number of trips you’ll get per hour on X.
To get the most accurate estimate for all of the services, you should fill out the variables for each of them separately.
So, let’s say you estimate 2.2 trips per hour on average with UberX.
Now, go back and change the trips per hour variable to 1 and lower the average trip distance a bit to get a more accurate estimate for BLACK and SUV.
We hope you enjoy using the calculator! Play around with it.
Change the variables to see how each one affects how much you could make in different scenarios.
Sample Scenario
Here’s a sample scenario.
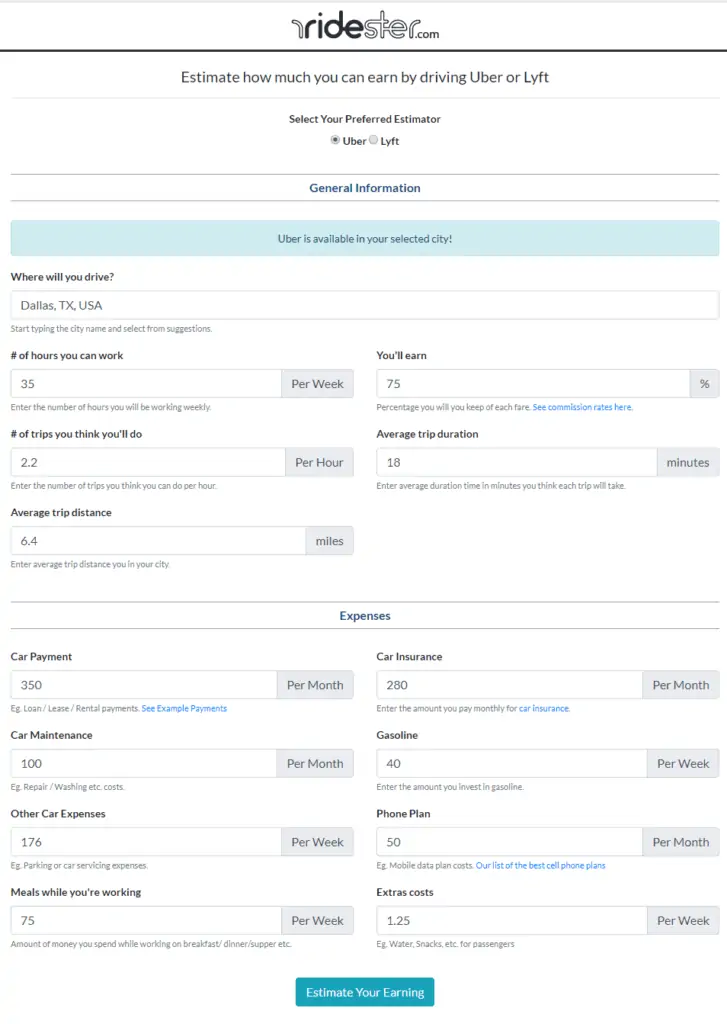
I’m going to fill out the Earnings Calculator as a Dallas driver.
I’m going to work 7 hours a day, 5 days a week, for a total of 35 hours a week.
I’ll estimate that I’ll spend $15 a day on food (three snacks or meals at $5 each)
My car payment is roughly $350 a month, my insurance is $280 a month.
I’m guessing I’ll spend about $40 a week on gas (I have a hybrid).
My phone bill is $100 a month, but I’m only going to allocate $50 of that to Uber driving — since I do use it for other things.
My extras cost is very low because I only provide water and most people don’t take it! So, I’m going to give that just $1.25 per week.
Since I’m going to be driving so many miles, I’m going to estimate I’ll need an oil change once a month, so I’m going to put $100 for monthly car maintenance.
My oil changes will probably be around $80 a month and that leaves a little left over for other things.
For other car expenses, I’m going to estimate $50 a week.
That’s probably a little high, but I figure some weeks, I’ll go way over.
I may get a parking ticket or a traffic ticket one week that will cost $100 alone.
So, this will add a little extra padding to cover for those occasional unexpected expenses.
And by the way, if you drive a lot, you will get more tickets than you normally would, so this is a good place to account for those.
I’m also going to add in my depreciation costs here of $448 a month (based on our depreciation example above).
But since this field is a weekly field, I’m going to divide $448 by 4.33 (4.33 is the number of weeks in an average month), so that comes to about $103 a week in depreciation expenses.
You see how large of an expense depreciation really is?
So, the total for the “Other Car Expenses” field is going to be made up of:
- $50 for routine car servicing expenses, including a little padding to pay for future unexpected expenses, such as parking or traffic tickets
- $103 – the weekly cost of depreciation – which is $448 per month (according to our example above)
- $28 per week for major future repairs, or $1,200 a year
Our total for Other Car Expenses will be $176.
I’m also going to guess that the average trip distance is 6.4 miles and the average trip duration is 18 minutes. (That’s assuming an average speed of 21 mph.)
Remember, in the Trip Duration field, you want to put the average number of minutes the customer will actually be in your car.
This field will use the number you put here and multiply it by the per-minute rate Uber and Lyft charge the passengers.
So, don’t add any minutes for pick-up time or waiting for the rider to get to the car.
This is strictly for the time the trip will take from the time the passenger gets in the car until the time you drop them off.
This is what my calculator looks like with the above information filled in:
And these are my results:
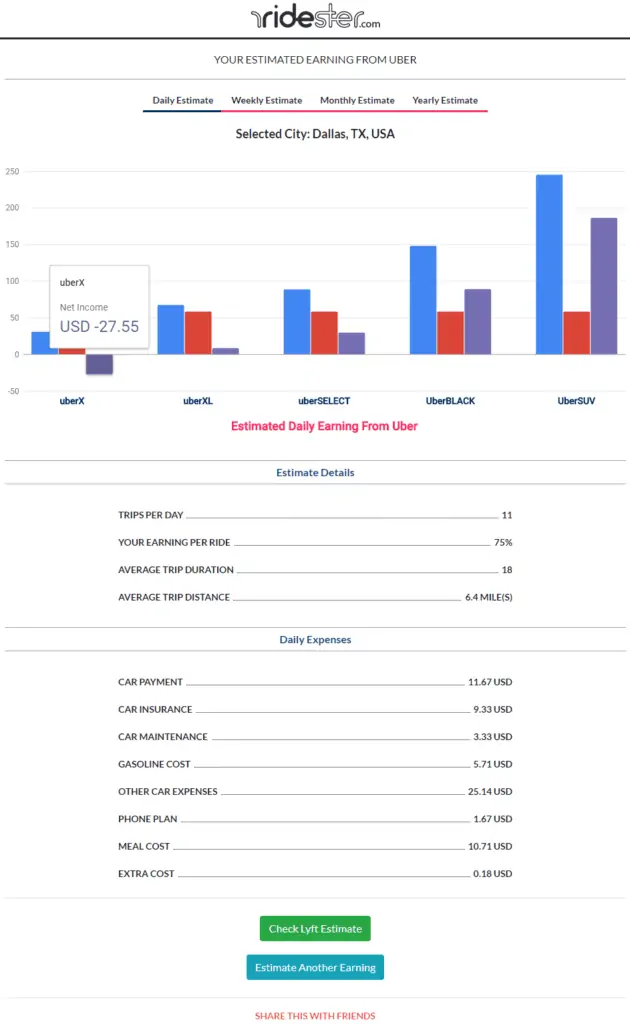
Unfortunately, I’m not going to make any money under this scenario.
Something will have to change! I’ll have to either figure out a way to do more trips per hour (very difficult) or to get longer trips (less difficult).
Or, I have to figure out a way to get my expenses way down (difficult but not impossible).
The Real Benefit of the Driver Earnings Calculator
The real benefit of the calculator here is that it has told me something very important.
If I’m a prospective new driver, it has told me that I’m not going to make any money with this particular car.
I’m going to have to get a cheaper car that’s less expensive to run.
Since there aren’t really much cheaper new cars than $20,000–$25,000, it tells me I’m going to have to get a used car.
That’s how the calculator can really help you.
Plug in a scenario and see how it looks.
If it doesn’t look good, try plugging in lower car payments and less depreciation (which you can achieve by getting a used car).
Then you can figure out exactly how much you should spend on a car.
The other great benefit is that it breaks down your expenses by day! It tells you exactly how much you need to earn each day before you break even.
By having these numbers, you can really get on the road to profitability by knowing what you have to do each day to make money.
In my sad case here, I have to earn $67 before I break even.
While that’s depressing, it’s invaluable to know.
If I didn’t know, I might quit when I get to $70 thinking I had done well! So this will keep me on the road a few more hours so I can actually make a little money.
How Much Do Drivers Make?
Uber and Lyft both have been almost completely silent about driver earnings.
A few years ago, Uber released some earnings figures publicly that showed drivers making far more than anyone thought.
They said New York City drivers were averaging $90,000 a year.
However, those figures were quickly disputed by New York City drivers.
That was several years ago.
Since then, Uber has slashed rates and driver earnings have correspondingly come down.
Since they slashed rates, they haven’t publicly released any more earnings figures.
But, there have been many studies and surveys over the last few years that show varying earnings estimates.
However, they seem to agree that the most likely range of driver earnings is around $15–$18 per hour nationwide in gross earnings before expenses.
And these figures, in fact, resonate with our personal experience and conversations with drivers.
The problem with a “national” earnings average is that every market is different.
Different driving conditions and different rates in each city around the country make it very difficult to come up with a figure per city.
If you’re currently driving or thinking of driving, knowing the national average doesn’t really help you much.
You really need to know the average earnings figures for your city.
Some cities lend themselves to longer trips with little traffic. Drivers can earn more on these kinds of trips.
Other cities lean towards short trips (under 5 miles) with lots of traffic and these kinds of trips will greatly lower your earnings.
With the Ridester Earnings Calculator you can try various scenarios for your city.
If you live in a place where things are farther apart, you’ll be able to plug that information into the calculator to get an accurate prediction of how you’ll fare where you live! This will be a much more meaningful figure for you than any national average could be.
What Goes Into How Much I Can Earn?
As mentioned above, one of the key earnings factors is what the average length of trip will be in the city where you’ll drive.
Other factors include:
- Uber’s and Lyft’s rates in the city where you drive
- How many riders use Uber and Lyft where you drive
- How many drivers there are where you drive
- What Uber and Lyft services your car is eligible to drive for
Uber’s and Lyft’s rates vary from city to city.
However, they are more consistent now than they were a few years ago.
On average, they both charge around $1.00 per mile and usually somewhere between $0.10–$0.35 per minute.
But rates can range from $0.75 a mile in some cities to $1.75 per mile in New York City.
The next two factors, how many riders and how many drivers there are in your city, will tell you how busy you’ll be.
The busier the better, of course! If you’re a new driver, you may not have any idea how busy you’ll be or what the ratio of drivers to riders is, but we’ll show you how to come up with some very good estimates in a minute.
Another key factor is which Uber and Lyft services your car will quality to drive for.
If you have only an UberX vehicle (the lowest end), you will be tied to the lowest rates Uber and Lyft have.
If, on the other hand, you have a vehicle that qualifies for XL, BLACK, or SUV, you’ll be able to earn higher rates on some of your trips.
The Ridester Earnings Calculator will let you calculate earnings for all types of vehicles.
And you can mix and match.
If you have a vehicle that qualifies for XL, you can tell the calculator to give you earnings estimates if you drive 80 percent of your trips as X and 20 percent as XL.
A Look at Your Hidden Expenses
Most of your expenses are quite visible.
Gas, oil changes, maintenance, and things like that.
Anything you pay for out of pocket is very easy to calculate – including car and insurance payments.
But there are two major invisible expenses that you won’t see until much later.
But you will see them eventually.
They are future major repairs and depreciation.
When I talk to drivers about depreciation, they nod their heads in agreement, acknowledging that it is an expense — but then they have a blank look on their faces, like they have no idea how to calculate it.
That’s quite understandable because it’s not something they have to pay out of pocket every month, so it’s hard to know how to put a real number on it.
So, we’re going to give you a good rule of thumb so you can estimate your depreciation and add that into your monthly car expenses.
You won’t pay the depreciation expense each month, but you will pay it when you decide to sell or trade-in your car.
As far as future major repairs, that is also kind of a nebulous number that is hard for drivers to put a real number on.
But you can get a pretty good estimate based on your car make and model’s average repair bills over the life of the vehicle.
Because we can’t see those expenses right now, a lot of drivers tend to ignore them.
But you can’t ignore them when calculating your real income from driving.
In fact, you need to include them in your expense estimates to get the most accurate earnings prediction possible.
How to Calculate Depreciation
If you own or finance your car, depreciation will be a big expense for you.
In fact, it’s usually the largest expense of all.
If you ignore it, you will be fooling yourself into believing that you’re making a lot more than you really are.
It’s understandable that you might be tempted to ignore it since it’s so hard to know what your exact depreciation will be.
But there are industry averages that we can go by.
We’ll give you some widely accepted depreciation rates that you can apply to your car.
Depreciation varies depending based on the kind of car you have.
Higher quality, more expensive cars tend to depreciate less while lower-end inexpensive cars tend to depreciate much more.
Below are average annual depreciation rates for different car types:
| Car Type | Average Annual Depreciation Rate (based on car’s purchase price) |
| High End Cars: such as Lexus, Audi, and Mercedes | 10.4% |
| Mid-Range Cars: like the Camry, Sonata, and Accord | 15.6% |
| Low-End Cars: like the Prius, Civic, Kia, and Volkswagen Golf | 21.4% |
Since most drivers drive for Uber and Lyft’s lower end service, we’ll assume most UberX drivers have lower-end cars like the Prius and we’ll show you how to calculate the depreciation on it.
A 2018 Prius Two Eco is currently retailing for $25,165.
So, if we multiply that by 21.4 percent, we come up with $5,385 in yearly depreciation expenses.
Then we’ll divide $5,385 by 12 to come up with our monthly estimated depreciation expense figure.
$25,165 x 0.214 = $5,385.31 (Annual Depreciation Expense)
$5,385 ÷ 12 = $448.75 (Monthly Depreciation Expense)
Now that you have a rough estimate of your true depreciation expense, you’ll want to add that figure into your monthly expenses on the Ridester Driver Earnings Calculator.
We’ll show you how to do that in just a minute.
A depreciation of 21.4 percent isn’t an exact figure, of course, but it’s a best all-around estimate based on industry averages for lower-end cars.
Future Major Repairs
If you’re putting a lot of miles on your car driving for Uber and Lyft you will, on average, be looking at about $1,200 in major repairs per year.
This may not come in the first year, but it may come in the second.
Whenever it comes, it will come eventually, and you should calculate that into your monthly earnings figures so you can get the most accurate picture of what you’re really earning.
You can do some online research if you want to get an exact average expense picture for your model, make, and year of car.
That will give you the best estimate possible.
But for our purposes, we’ll use an average figure of $1,200 per year — or $100 a month.
You’ll also want to add this expense into the Ridester Earnings Calculator.
Understand Uber Costs to Calculate Your True Driver Income
We hope you can now see that there are many factors that go into determining how much you’ll make as an Uber driver.
From the number of Uber rides you give, to whether you’re giving more rides for a cheap service like UberPOOL or a higher-end service like UberSELECT, to whether you’re driving during times of surge pricing, your income will vary.
But using the calculator in this guide, you can get a much more accurate estimate of what you’ll earn.
Curious to see how much it will cost to take an Uber to a given location? Check out our Uber fare estimator.
This tool lets you get an Uber fare estimate much more easily than the Uber app, helping ensure you won’t get a nasty surprise after you see the bill for your next Uber trip.
It’s as simple as entering your pickup location and drop-off location, after which the fare calculator will generate an accurate Uber estimate for trips in both the United States and abroad.


But what I really want to know – what is the average miles, trips per hour to compare cities. I am leaving South Florida (summer too long and cost of living too high) for either Tampa or Atlanta (or maybe an even different city). The calculator assumes the same miles & trips/hr for every city.
In reality, you’ll earn $3.50/hour. I quit.
Depends heavily on where you drive honestly, I’ve made $600 in one day on three separate occasions. Over a dozen $300 8-hour shifts (this is all after gas expenses), and this is just for Lyft and in the last year.
Huge factors too, it really is completely dependent on where you drive. I moved to Asheville NC (also drive in TN) from Fort Lauderdale last year, and it seems to be way better here as far as profit. Busier places obviously get more ride requests, but pay less per hour/mile/etc. All about finding that sweet spot.
“Made” is the wrong word, Jimmy. After “gas” expenses. So you included your smallest expense, but none of the major ones. Did you even read the article?
You’re right, Jimmy. Depending at where you drive and what you drive you will earn between -$7 (yes, that’s a negative) and $3.50 per hour (I guess this is the “sweet spot”).
“Made” is the wrong word, Jimmy. After “gas” expenses. So your included your smallest expense, but none of the major ones. Did you even read the article?
“Made” is the wrong word, Jimmy. After “gas” expenses. So your included your smallest expense, but none of the major ones. Did you even read the article?